DARROW-YANNET Diagram Made Easy
DARROW-YANNET diagram is a two compartment model with respect to fluid. It is used to study how the volumes of extracellular and intracellular fluid changes in response to fluid disturbance in body.
With the help of DARROW-YANNET diagram, we go through each schematic diagram of fluid disturbance to learn how to interpret it and the pathological condition associated with it. We also Integrate the physiological changes seen in response to different fluid disturbance of body.
The y axis represents a solute concentration or osmolality whereas the x axis is the volume of intracellular (2/3) and extracellular (1/3) fluid. Moving to the right represents relative level of Extracellular fluid and to the left represents relative Intracellular fluid.
At steady state, the intracellular fluid and Extracellular fluid osmolality’s are same and there is no osmotic gradient to move fluid across the compartments.
A change in Extracellular osmolality determines an intracellular volume. If Extracellular osmolality goes up, it causes fluid to move into the Extracellular compartment from intracellular compartment through osmosis (Hypo to Hyper).
A decrease in Extracellular osmolality causes the fluid to move into the Intracellular compartment from Extracellular compartment by the process of Osmosis (Hypo to Hyper).
And this shifting of fluid occurs till the osmolality of Extracellular and Intracellular fluid becomes same.
There are 6 schematic DARROW-YANNET diagram that illustrates different body fluid disturbance.
We divide it in two parts –
1. Body fluid disturbance due to fluid loss.
(a) Isotonic Fluid Loss
(b) Hypotonic Fluid Loss
(c) Hypertonic Fluid Loss
2. Body fluid disturbance due to fluid gain.
(a) Isotonic Fluid Gain
(b) Hypotonic Fluid Gain
(c) Hypertonic Fluid Gain
And a loss or gain of fluid occurs only from the Extracellular Compartment.
Following are the Steps to follow while interpreting DARROW-YANNET diagrams -:
(a) Check the Extracellular fluid volume whether there is loss or gain of fluid.
(b) Check the Extracellular Osmolality to decide the movement of fluid.
(c) Check the Intracellular fluid volume to recheck the osmolality of Extracellular Compartment with the help of Osmotic gradient.
(d) Check whether there is Isotonic, Hypotonic and Hypertonic loss or gain of fluid in Extracellular Compartment.
(e) Check the Pathological cause associated with Fluid Disturbance.
1. Body fluid disturbance due to Fluid Loss -:
(A) Isotonic Fluid Loss
The solid line shows the body fluid compartment in normal conditions whereas the dashed line indicates disturbances in body fluids.
This DARROW-YANNET diagram shows that there is no change in Extracellular Osmolality but a decrease in Extracellular fluid Volume.
No change in Extracellular Osmolality despite a decrease in Extracellular volume indicates that there is equal loss of fluid and solute from Extracellular compartment i.e Isotonic loss of fluid which tends to maintain both Intracellular and Extracellular compartment in steady state and no movement of fluid is seen.
Pathologically Isotonic Fluid loss as indicated in this DARROW-YANNET diagram is seen in Blood loss from trauma/Hemorrhage, Isotonic urine loss and as an immediate effect of vomiting or diarrhea.
(B) Hypotonic Fluid Loss
This DARROW-YANNET diagram shows that there is an Increase in Extracellular Osmolality with a decrease in Extracellular and Intracellular Fluid volume.
An increase in Extracellular Osmolality indicates that the fluid moves from Intracellular Compartment to Extracellular Compartment through Osmosis (Hypo to Hyper).
A decrease in Intracellular fluid Volume also suggests that the Osmotic gradient is towards Extracellular Compartment which reconfirms the movement of fluid.
An osmotic gradient towards Extracellular Compartment also points that Extracellular fluid is a Hypertonic side which tends to receive fluid from the Hypotonic Intracellular Compartment.
Extracellular Compartment being a Hypertonic solution side suggests that there is more loss of Fluid than Solute ie. Hypotonic loss of fluid from the Extracellular space.
Pathologically Hypotonic Fluid loss as indicated in this DARROW-YANNET diagram is seen during Dehydration which is common in summer season and seen in Patient with Diabetes Insipidus where due to lack of Anti-diuretic Hormone (ADH), the body can’t able to concentrate the fluid resulting into a Hypotonic loss of fluid in the form of Urine.
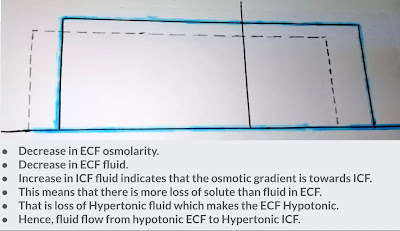
(C) Hypertonic Fluid Loss.
This DARROW-YANNET diagram shows that there is a Decrease in Extracellular Osmolality with a decrease in Extracellular fluid volume but an increase in Intracellular Fluid volume.
A decrease in Extracellular Osmolality indicates that fluid moves from Extracellular Compartment to Intracellular Compartment through Osmosis (Hypo to Hyper).
An increase in Intracellular fluid volume also suggests that the Osmotic gradient is towards Intracellular compartment which reconfirms the movement of fluid.
An osmotic gradient towards Intracellular Compartment also points that Extracellular fluid is a Hypotonic solution side which causes movement of fluid towards Hypertonic Intracellular Compartment.
An Extracellular Compartment being a Hypotonic solution side suggests that there is more loss of Solute than fluid ie. Hypertonic loss of fluid in Extracellular Compartment.
Pathologically Hypertonic Fluid loss as indicated in this DARROW-YANNET diagram is seen in Addison’s Disease which is a primary adrenal insufficiency due to the deficiency of Aldosterone. The Role of Aldosterone is to retain sodium in order to promote water resorption in the body. Hence, Deficiency of Aldosterone leads to Hypertonic Fluid loss in the Urine.
2. Body Fluid Disturbance due to fluid Gain -:
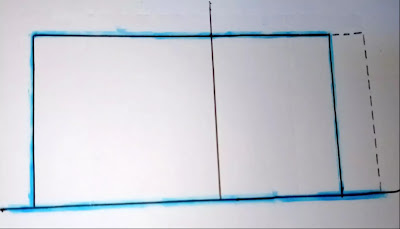
(A) Isotonic Fluid Gain
The solid line shows the body fluid compartment in normal conditions whereas the dashed line indicates disturbances in body fluids.
This DARROW-YANNET diagram shows that there is no change in Extracellular Osmolality but an increase in Extracellular fluid Volume.
No change in Extracellular Osmolality despite an increase in Extracellular volume indicates that there is equal addition of fluid and solute in the Extracellular compartment i.e Isotonic addition of fluid which tends to maintain both Intracellular and Extracellular compartment in steady state.
Pathologically Isotonic addition of fluid as indicated in this DARROW-YANNET diagram is seen during isotonic saline infusion and seen in Conn’s Syndrome where due to an increased level of Aldosterone promotes excess retention of Sodium and water into an Extracellular Compartment of the body.
(B) Hypotonic Fluid Gain
This DARROW-YANNET diagram shows that there is a Decrease in Extracellular Osmolality with an increase in Extracellular as well as Intracellular Fluid volume.
A decrease in Extracellular Osmolality indicates that the fluid moves from Extracellular Compartment to Intracellular Compartment through Osmosis (Hypo to Hyper)
An increase in Intracellular fluid volume also suggests that the Osmotic gradient is towards Intracellular compartment because a loss or gain of fluids occurs only from the Extracellular Compartment.
An Osmotic gradient towards Intracellular Compartment also points out that the Extracellular fluid is a Hypotonic solution side which causes movement of fluid towards Hypertonic Intracellular Compartment.
Extracellular Compartment being a Hypotonic solution side suggests that there is more addition of Fluid than Solute ie. Hypotonic addition of fluid in Extracellular space.
Pathologically Hypotonic addition of fluid as indicated in this DARROW-YANNET diagram is seen in Primary Polydipsia which is characterised by excessive drinking of water in the absence of physiological stimuli to drink i.e Pathological Drinking.
Other Pathological cause is due to the infusion of Hypotonic saline and is seen in patient suffering from Syndrome of Inappropriate Anti-diuretic Hormone (SIADH). Inappropriate Level of ADH promotes excessive retention of water instead of excreting it normally in Urine.
(C ) Hypertonic Fluid Gain
This DARROW-YANNET diagram shows that there is an Increase in Extracellular Osmolality with an increase in Extracellular volume but there is a decrease in Intracellular Fluid volume.
An increase in Extracellular osmolality indicates that fluid moves from Intracellular Compartment to Extracellular Compartment through Osmosis (Hypo to Hyper)
A decrease in Intracellular fluid Volume also suggests that the Osmotic gradient is towards Extracellular Compartment which reconfirms the movement of fluid.
An osmotic gradient towards Extracellular Compartment also points that Extracellular fluid is under Hypertonic solution side which tends to receive fluid from a Hypotonic Intracellular Compartment.
The Extracellular Compartment being a Hypertonic solution side indicates that there is more addition Solute than fluid i.e Hypertonic addition of fluid in Extracellular Compartment.
Pathologically Hypertonic addition of fluid as indicated in this DARROW-YANNET diagram is seen due to Excessive salt intake in diet, by infusion of Hypertonic saline and mannitol.
Pathologically it is also seen during the Initial effect of Hyperglycemia in patient with suffering from Diabetes Mellitus.


Leave a Comment